Note
Data used throughout this example can be found in <ROOT>/examples/contaminant_example. If SIMBAD is part of your CCP4 installation,
then the example files can be downloaded as part of the GitHub repository.
Check out this page explaining the simbad-contaminant script command line options.
In this example, the simbad-contaminant script simply takes the crystallographic data file in MTZ format, and runs the contaminant search on your local machine.
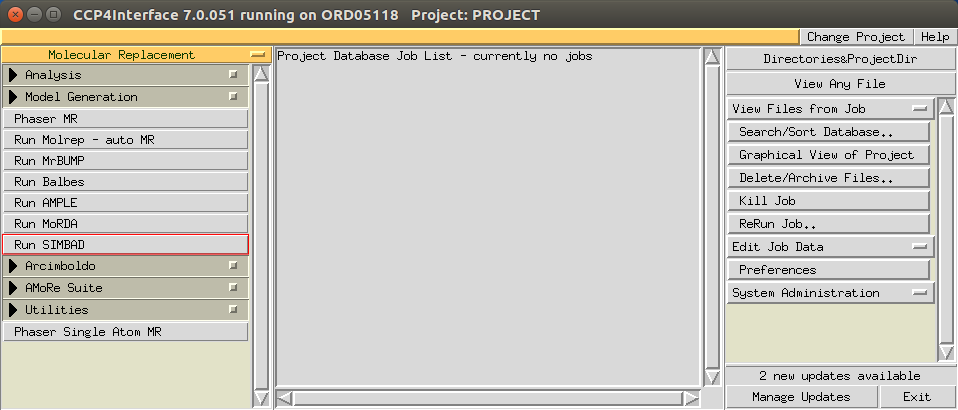
SIMBAD can be found under the Molecular Replacement menu in the CCP4i GUI:
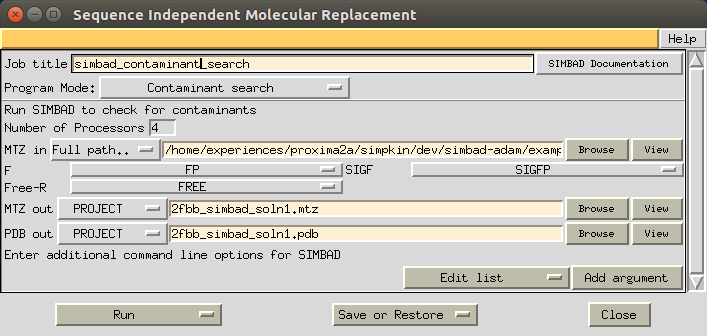
Opening SIMBAD will bring you to the following menu:

To run the lattice search, all that is needed is an MTZ file:
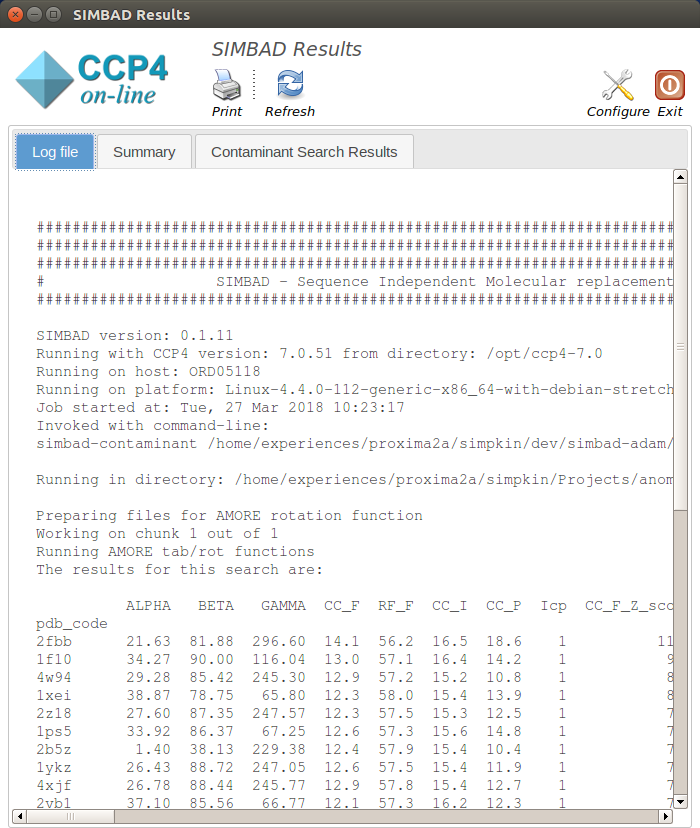
On starting SIMBAD a separate window will appear summarising the progress of the SIMBAD contaminant search and any results found. The window will contain up to three tabs, the contents of which are explained below:
Output Tabs
This displays the text output by SIMBAD as it is running. Any problems or errors will be displayed here.
The Contaminant Search Results tab contains 5 different sections. Below you can find information about each:
Sections
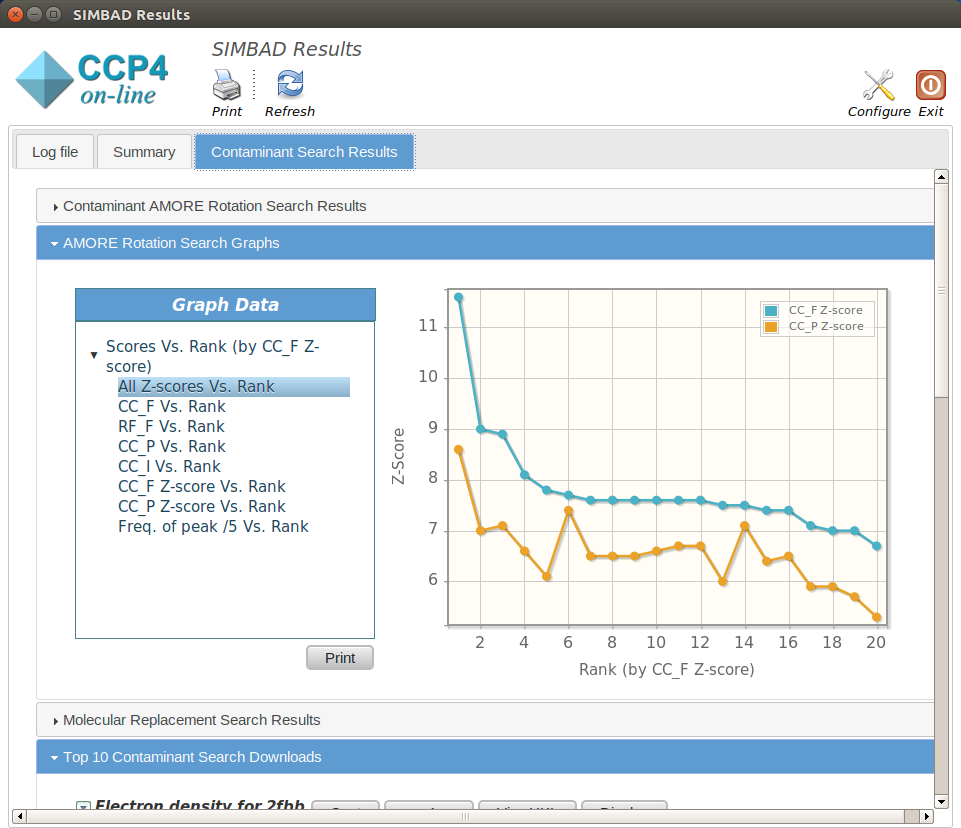
This shows the results from the AMORE Rotation Search carried out on the contaminant database. The columns of the table are:
The structures are scored by CC_F_Z_score score where a higher score is better.
Molecular replacement is performed on the top 20 structures identified by the Contaminant Search. This section displays the results of that molecular replacement.
By default SIMBAD runs Molecular replacement using MOLREP. If run the following columns are added to the table:
Alternatively SIMBAD can run Molecular replacement using PHASER. If run the following columns are added to the table:
Following Molecular replacement, refinement is run using REFMAC. This add the following columns are added to the table:
Note
Typically a result with a final_r_fact and a final_r_free below 0.45 is indicative of a solution.
Additionally if there is anomalous signal in your data set SIMBAD will try to validate the quality of the molecular replacement solution using by plotting the peaks from an anomalous fourier map. If run the following columns are added to the table:
This section contains the refined placed model and mtz for the top 10 solutions in the contaminant database search (as ranked by final_r_free)
Note
This section may contain less than 10 solutions if for example a solution was found and the molecular replacement search ended early
This section contains the molecular replacement and refinement logs for the top 10 solutions in the contaminant database search (as ranked by final_r_free)
Note
This section may contain less than 10 solutions if for example a solution was found and the molecular replacement search ended early
The summary tab contains three different sections. Below you can find information about each:
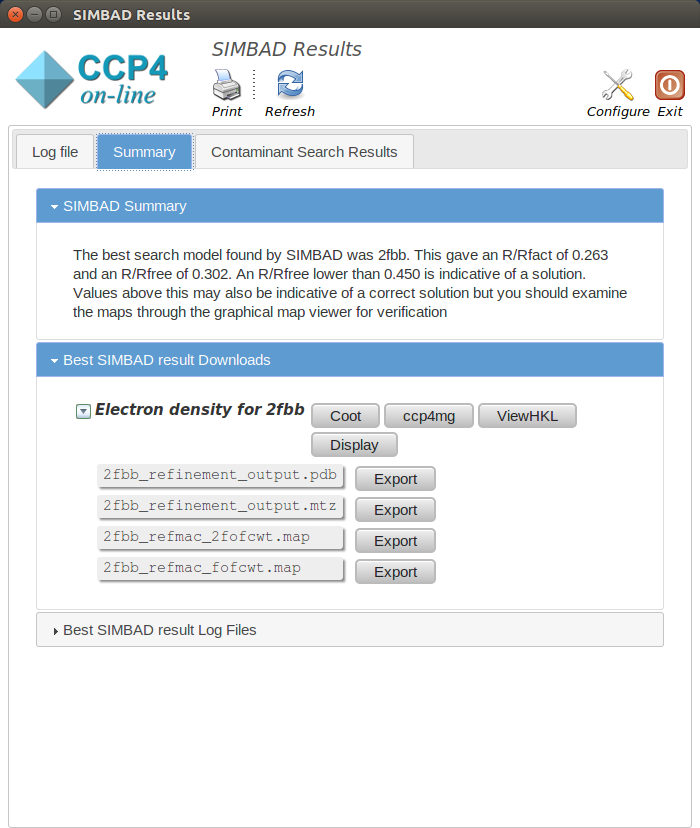
This details the best model found by SIMBAD and reports the final_r_fact and final_r_free scores found
This section contains the refined placed model and mtz for best solution found by the lattice parameter search (as ranked by final_r_free)
This section contains the molecular replacement and refinement logs for best solution found by the lattice parameter search (as ranked by final_r_free)