Note
Data used throughout this example can be found in <ROOT>/examples/lattice_example. If SIMBAD is part of your CCP4 installation,
then the example files can be downloaded as part of the GitHub repository.
Check out this page explaining the simbad-lattice script command line options.
The lattice parameters for a crystallised protein are often unique and therefore provide a quick and easy route to identify previously solved structures. The SIMBAD lattice search compares the lattice parameters of an input MTZ file to all the structures in the PDB.
In this example, the simbad-lattice script simply takes the crystallographic data file in MTZ format, and runs the lattice search followed by Molecular Replacement on your local machine.
simbad-lattice \
    input/1dtx.mtz
Alternatively the simbad-lattice search can be run without Molecular Replacement by providing the unit cell and the space group for a data set, as shown below:
simbad-lattice -uc 73.5820,38.7330,23.1890,90.0000,90.0000,90.0000 -sg P212121
Upon running SIMBAD results will be output to the terminal:
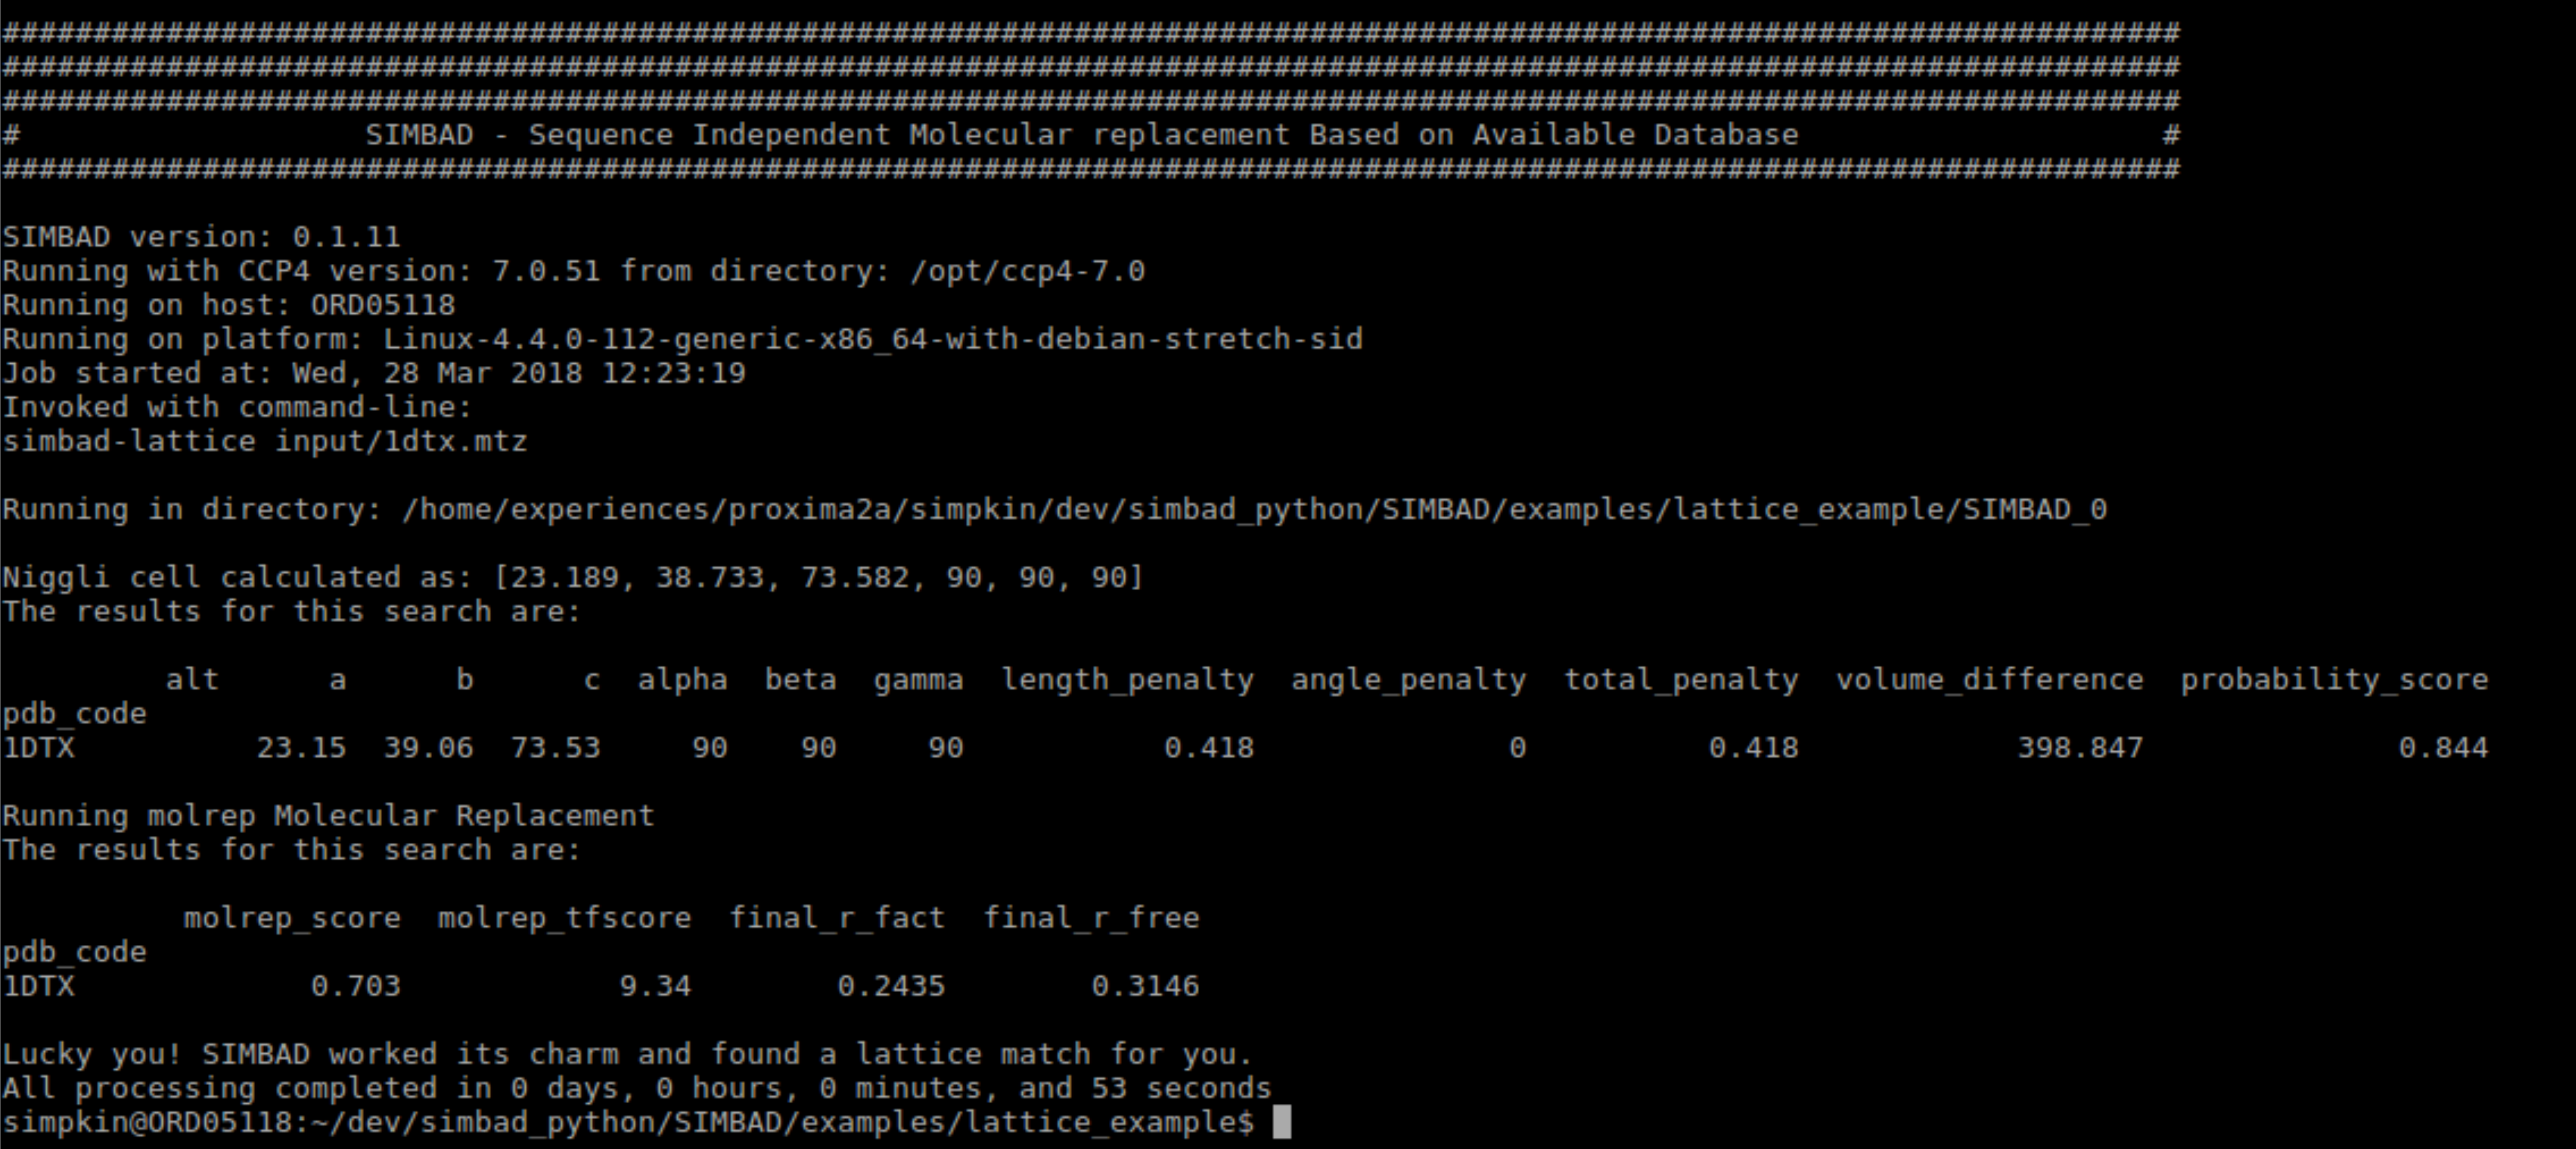
The Lattice Parameter Search outputs 2 tables. Below you can find information about each:
This shows the results from the Lattice Parameter Search. The columns of the table are:
The structures are scored by total_penalty score where a lower score is better.
Molecular replacement is performed on the top 20 structures identified by the Lattice Parameter Search. This section displays the results of that molecular replacement.
By default SIMBAD runs Molecular replacement using MOLREP. If run the following columns are added to the table:
Alternatively SIMBAD can run Molecular replacement using PHASER. If run the following columns are added to the table:
Following Molecular replacement, refinement is run using REFMAC. This add the following columns are added to the table:
Note
Typically a result with a final_r_fact and a final_r_free below 0.45 is indicative of a solution.
Additionally if there is anomalous signal in your data set SIMBAD will try to validate the quality of the molecular replacement solution using by plotting the peaks from a phased anomalous fourier map. If run the following columns are added to the table: